
By Joe Berk
People reload ammunition for different reasons. It used to be you could save money by reloading, and I suppose for the more exotic cartridges (any Weatherby ammo, the big elephant rounds like .458 Win Mag, the .416 Rigby, etc.) that’s still the case. It’s not the case for the more common rounds like 9mm, .45 ACP, and .223 Remington; bulk ammo for those is so inexpensive you’d be hard pressed to reload for as little as that ammo costs. Sometimes people reload because factory ammo is no longer available or it’s very tough to find. But most of us reload for accuracy. We can experiment with different combinations of components and tailor a combo to a particular firearm to find the sweet spot…that combination of components that provides the tightest groups. I’m in that category; it’s why I reload.
When I’m testing for accuracy and I get a tight group, I always wonder: Is it because of the combination of components, or is it just a random event? Usually, if the group size is repeatable, we conclude that it is the component combination, and not just a random good group that results from all the planets coming into alignment. But is there a better way? You know, one that shows with more certainty that it’s the component combination, and not just a fluke?
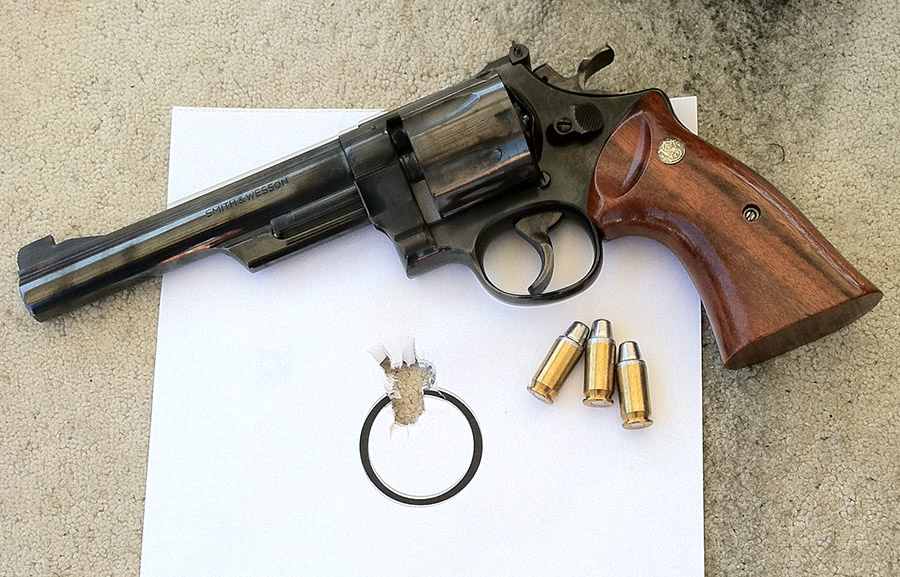
This article is a bit different. It’s not just a story about a gun or about reloading ammunition. It includes those things, but it’s more. This story is about applying the Taguchi design of experiments technique to .45 ACP load development for ammo to be used in a Smith and Wesson Model 25 revolver (the one you see in the photo above).
I’m guessing you probably never heard of Taguchi. That’s okay; most folks have not. Taguchi testing is a statistical design of experiments approach that allows evaluating the impact of several variables simultaneously while minimizing sample size. The technique is often used in engineering development activities, and I used it regularly when I was in the aerospace world. The technique was pioneered by Genichi Taguchi in Japan after World War II, and made its way to the US in the mid-1980s. I used the Taguchi technique when I ran engineering and manufacturing groups in Aerojet Ordnance (a munitions developer and manufacturer) and Sargent Fletcher Company (a fuel tank and aerial refueling company).
Taguchi testing is a powerful technique because it allows identifying which variables are significant and which are not. Engineers are interested in both. It lets you know which variables you need to control tightly during production (that is, which tolerances have to be tight), and it identifies the others that are not so critical. Both are good things to know. If we know which variables are significant and where they need to be, we can change nominal values, tighten tolerances, and maybe do other things to achieve a desired output. If we know which variables are not significant, it means they require less control. We can loosen tolerances on these variables, and most of the time, that means costs go down.
Like I said above, I used Taguchi testing in an engineering and manufacturing environment with great success. The Taguchi approach did great things for us. When I worked in the cluster bomb business, it allowed us to get the reliability of our munitions close to 100%. When I worked in a company that designed and manufactured aerial refueling equipment (think the refueling scene in the movie, Top Gun), it helped us to identify and control factors influencing filament-wound F-18 drop tanks. In that same company, it helped us fix a 20-year-old reliability problem on a guillotine system designed to cut and clamp aerial refueling hoses if failures elsewhere in the refueling system prevented rewinding the hose. You don’t want to land in an airplane trailing a hose filled with JP4 jet fuel. Good stuff, Taguchi testing is.
As you know from reading our other Tales of the Gun stories, the idea in reloading is to find the secret sauce…the perfect recipe of bullet weight, propellant, brass case manufacturer, and more, to find the best accuracy for a given firearm. Hey, I thought…I could apply the Taguchi technique to this challenge.
When you do a Taguchi experiment, you need to define a quantifiable output variable, and you need to identify the factors that might influence it. The output variable here is obvious: It’s group size on the target. The input variables are obvious, too. They would include propellant type, propellant charge, primer type, bullet weight, brass type, bullet seating depth, and bullet crimp. We’re trying to find which of these factors provides the best accuracy. I wanted to turn my Model 25 Smith and Wesson into a hand-held tack driver.
When Taguchi developed his testing approach, he made it simple for his followers. One of the things he did was define a simple test matrix, which he called an L8 orthogonal array. It sounds complicated, but it’s not. It just means you can evaluate up to seven different input variables with each at two different levels. That’s a bit complicated, but understanding it is a little easier if you see an example. Here’s what the standard Taguchi L8 orthogonal array (along with the results) looked like for my Model 25 load development testing:
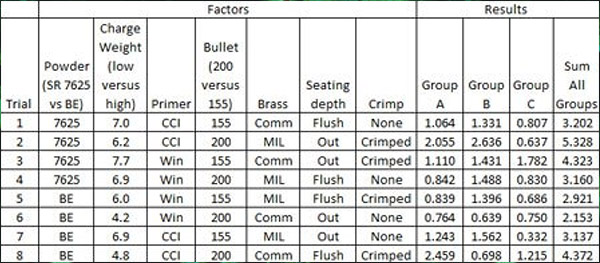
As the above table shows, three sets of data were collected. I tested each load configuration three times (Groups A, B, and C), and I measured the group size of each 3-shot group. Those group sizes became the output variables.
The next step involved taking the above data and doing a standard Taguchi ANOVA (that’s an acronym for analysis of variance). ANOVA is the statistical method used for evaluating the output data (in our case, the group sizes) to assess which of the above input variables most influenced accuracy. That’s a complex set of calcs greatly simplified by using Excel. The idea here is to find the factor with the largest ANOVA result. You see, any time you measure a set of results, there’s going to be variation in the results. Where it gets complicated is the variation can be due to randomness (the variation in the results that would occur if you left all of the inputs the same). Or, the variation can be due to something we changed. We want to know if the differences are due to something we did (like changing or adjusting a component) or if they are due to randomness alone. I cranked through the ANOVA calcs with Excel, and here’s what I obtained…
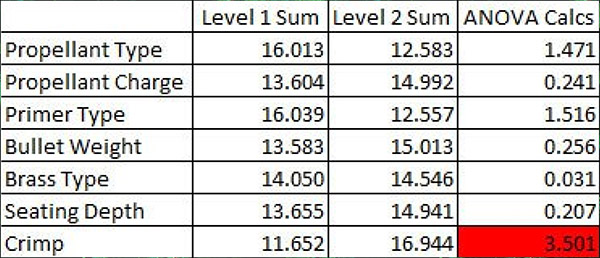
The above results suggest that crimping (squeezing the bullet by slightly deforming the case mouth inward) has the greatest effect on accuracy (it had the largest ANOVA calculated result). The results suggest that cartridges with no crimp are more accurate than rounds with the bullet crimped. But it’s a suggestion only; it doesn’t mean it’s true. The next step is to evaluate if the differences are statistically significant, and doing that requires the next step in the ANOVA process. This gets really complicated (hey, I’m an engineer), but the bottom line is that we’re going to calculate a number called the f-ratio, and then compare our calculated f-ratio to a reference f-ratio. If the calculated f-ratio (the one based on the test results above) exceeds the reference f-ratio, it means that crimping versus no crimping makes a statistically significant difference in accuracy. If it not not exceed the reference f-ratio, it means the difference is due to randomness. Using Excel’s data analysis feature (the f-test for two samples, for you engineers out there) on the crimp-vs-no-crimp results shows the following:
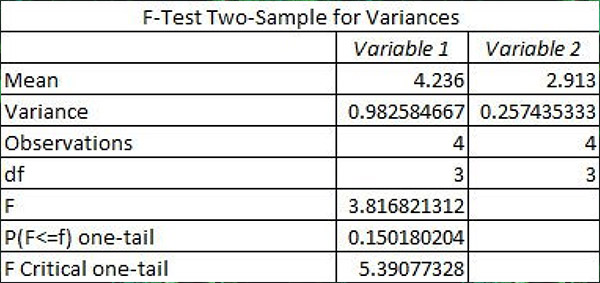
Since the calculated f-ratio (3.817) does not exceed the critical f-ratio (5.391), I could not conclude that the findings are statistically significant. What that means is that the difference in accuracy for the crimped versus uncrimped rounds is due to randomness alone.
Whew! So what does all the above mean?
All right, here we go. This particular revolver shot all of the loads extremely well. Many of the groups (all fired at a range of 50 feet) were well under an inch. Operator error (i.e., inaccuracies resulting from my unsteadiness) overpowered any of the factors evaluated in this experiment. In other words, my unsteadiness was making a far bigger difference than any change in the reloading recipe.
Although the test shows that accuracy results were not significantly different, this is good information to know. What it means is that all of the test loads (the different reloading recipes) are reasonably accurate. If I had used a machine rest, I might have seen a statistically significant difference. Stated differently, the test told me that I needed to use a machine rest with this gun to see which load parameters were really playing a role in accuracy. Without it, my flaky shooting skills (or as the statisticians like to say, my randomness) overpowered any accuracy gains to be realized by playing with component factors.
That said, though, I like that 4.2 grains of Bullseye load with the 200 grain semi-wadcutter bullet, and it’s what I load for my Model 25. But I now know…the gun shoots any of these loads well, and crimping versus no crimping doesn’t really make a difference.
Check out our other Tales of the Gun stories here.
Join our Facebook ExNotes page!
Never miss an ExNotes blog:
Help us keep the lights on:
Don’t forget: Visit our advertisers!

I had never heard of Taguchi testing.
Very interesting.
Joe, you are such a “gun nerd” but it sounds like fun.
It is indeed, Tom. I think the next time I try using Taguchi I will do it for a rifle cartridge, instead. Using a benchrest with a rifle removes much of the randomness associated with a handgun accuracy test. Right now, though, the dirt road leading to the range is still flooded, so nothing is going to happen for a while.
“What that means is that the difference in accuracy for the crimped versus uncrimped rounds is due to randomness alone.”
I think it actually means that you cannot say with X% confidence there is a difference. It might still be true and not due to randomness alone.
You are correct. I simplified the explanation, perhaps too much. There is always a confidence level associated with these assessments, typically 90% or 95%. Thanks for the clarification.
Joe, This brought back a lot of old memories from the guillotine testing. The Taguchi methodology drove us in the right direction and allowed for much earlier completion of qualification testing.
That was a great project and a great success story. I miss the good times we had at Sargent-Fletcher.
Various combinations of human talent and character can produce a result defined as “best”!
Experimentation of such might be similar to a Taguchi type system???
Possibly, but not likely. To work best, you need to have a quantifiable output.
As a reloader and an engineer, this article spoke to me! I am in the process of loading rounds for my first sanctioned IDPA match and trying to control as many variables as I can. I was sorting cases last night and explaining to my wife why I wanted them to all be the same brand. I explained case capacity, burn rates, primer functionality and why I shoot coated, cast bullets instead of jacketed. She was snoring peacefully before I finished… I did manage to get in that I want to control all of the variables I can so that my inconsistency is all I need to focus on during the match.
I’ll be waiting patiently for the rifle test!